Technologies:
ReactJS
CartoDB
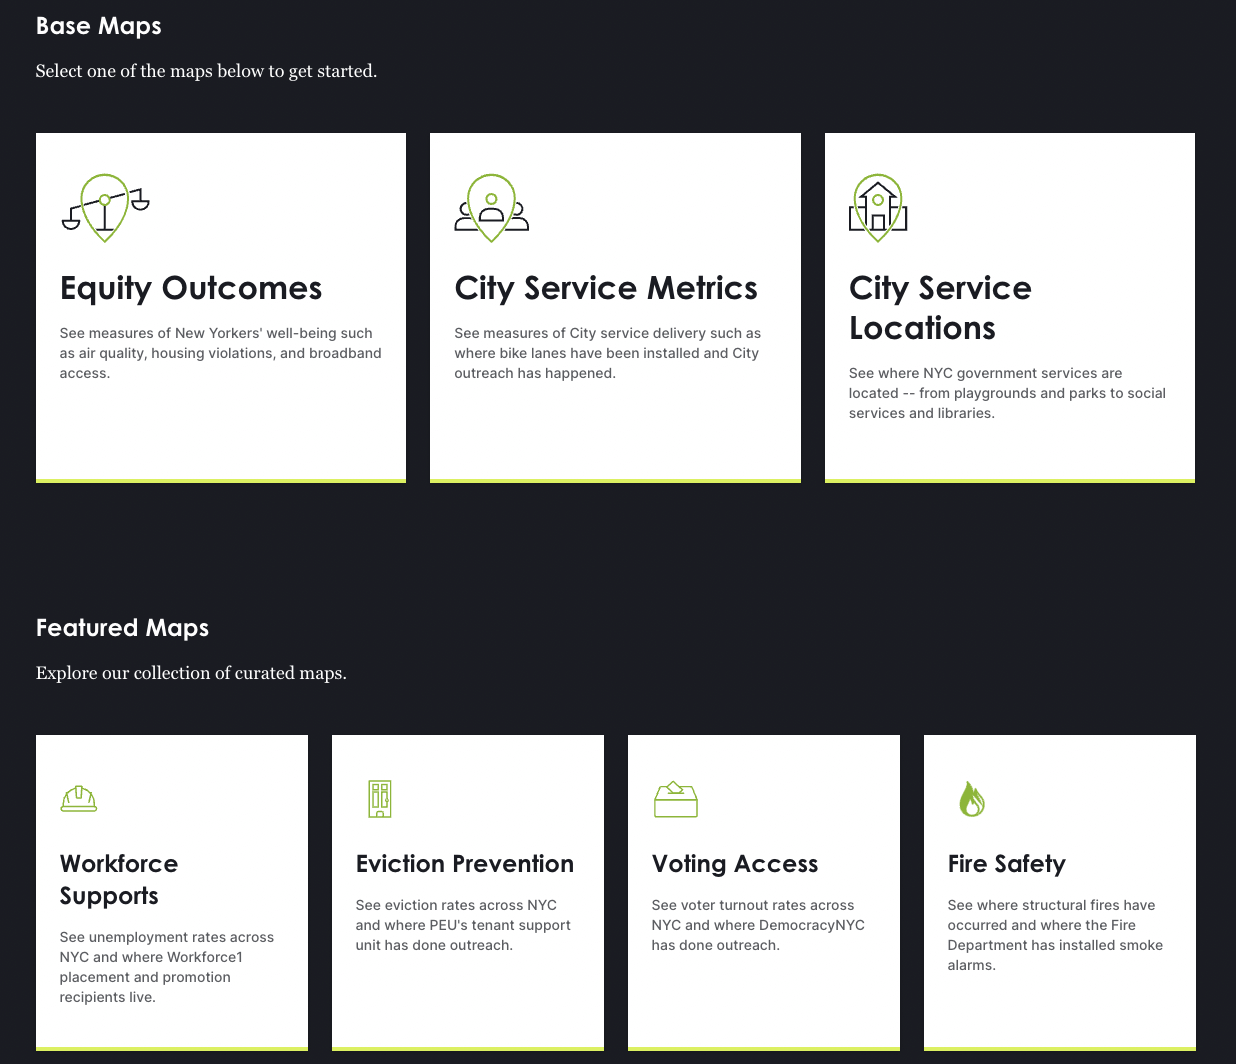
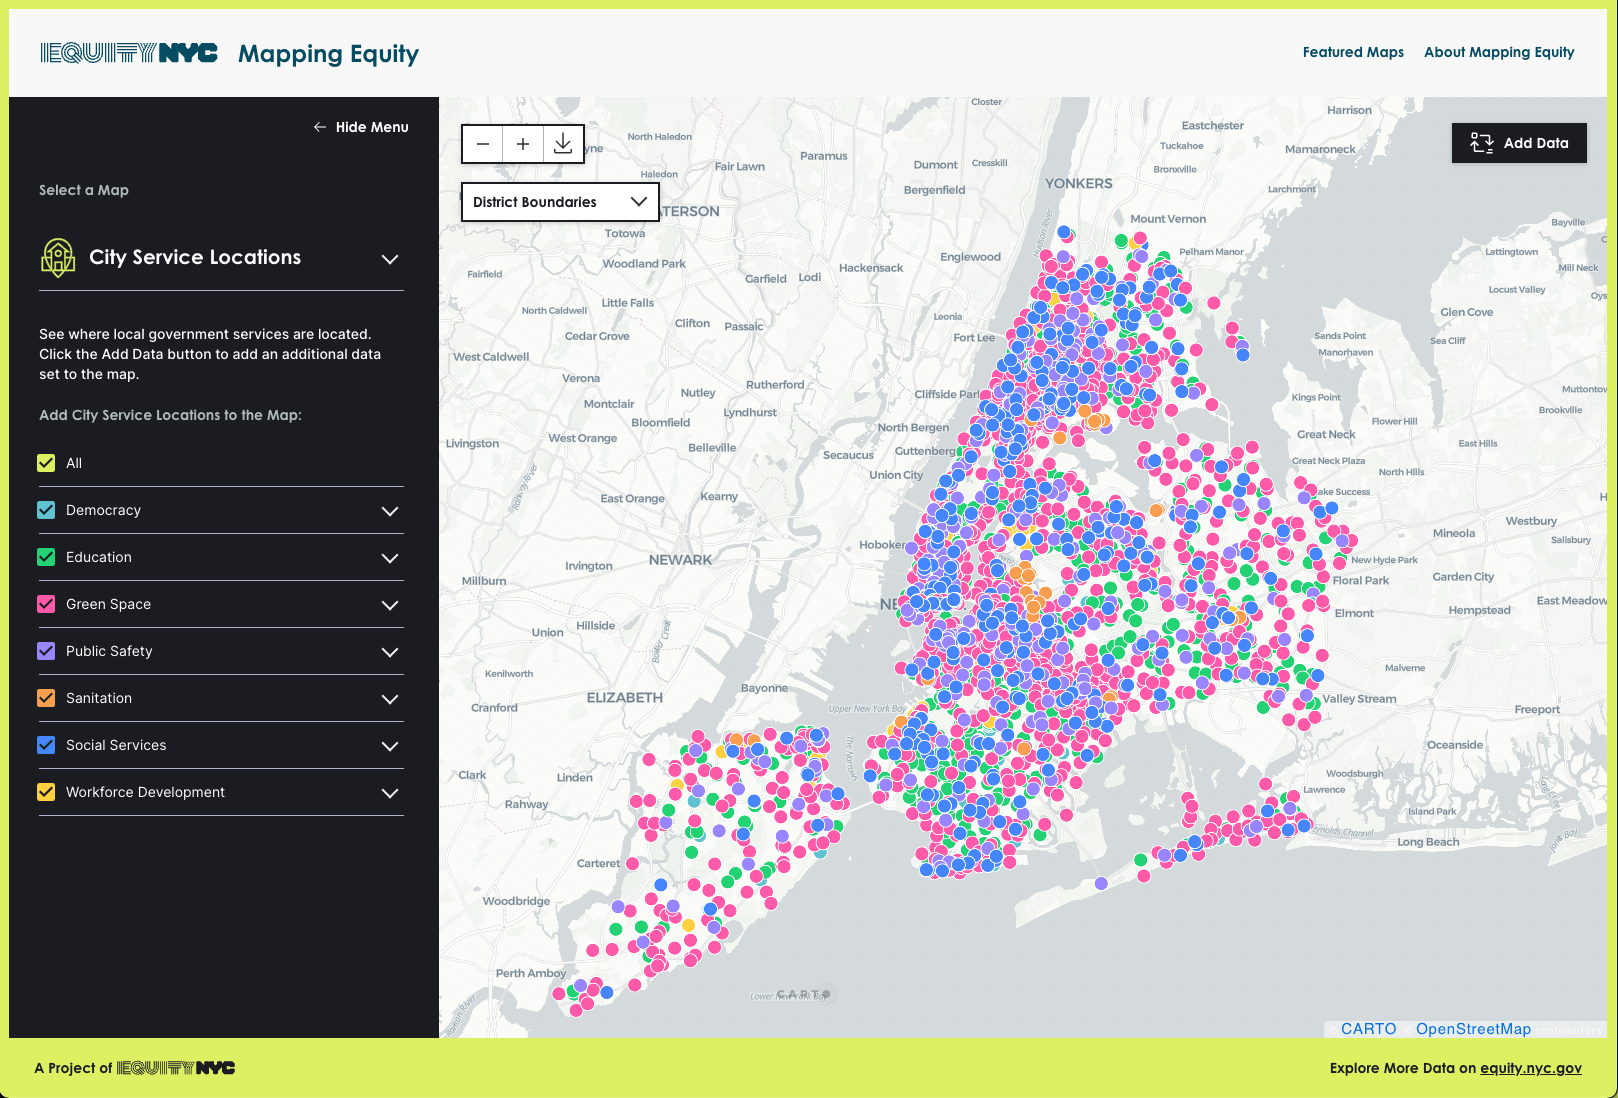
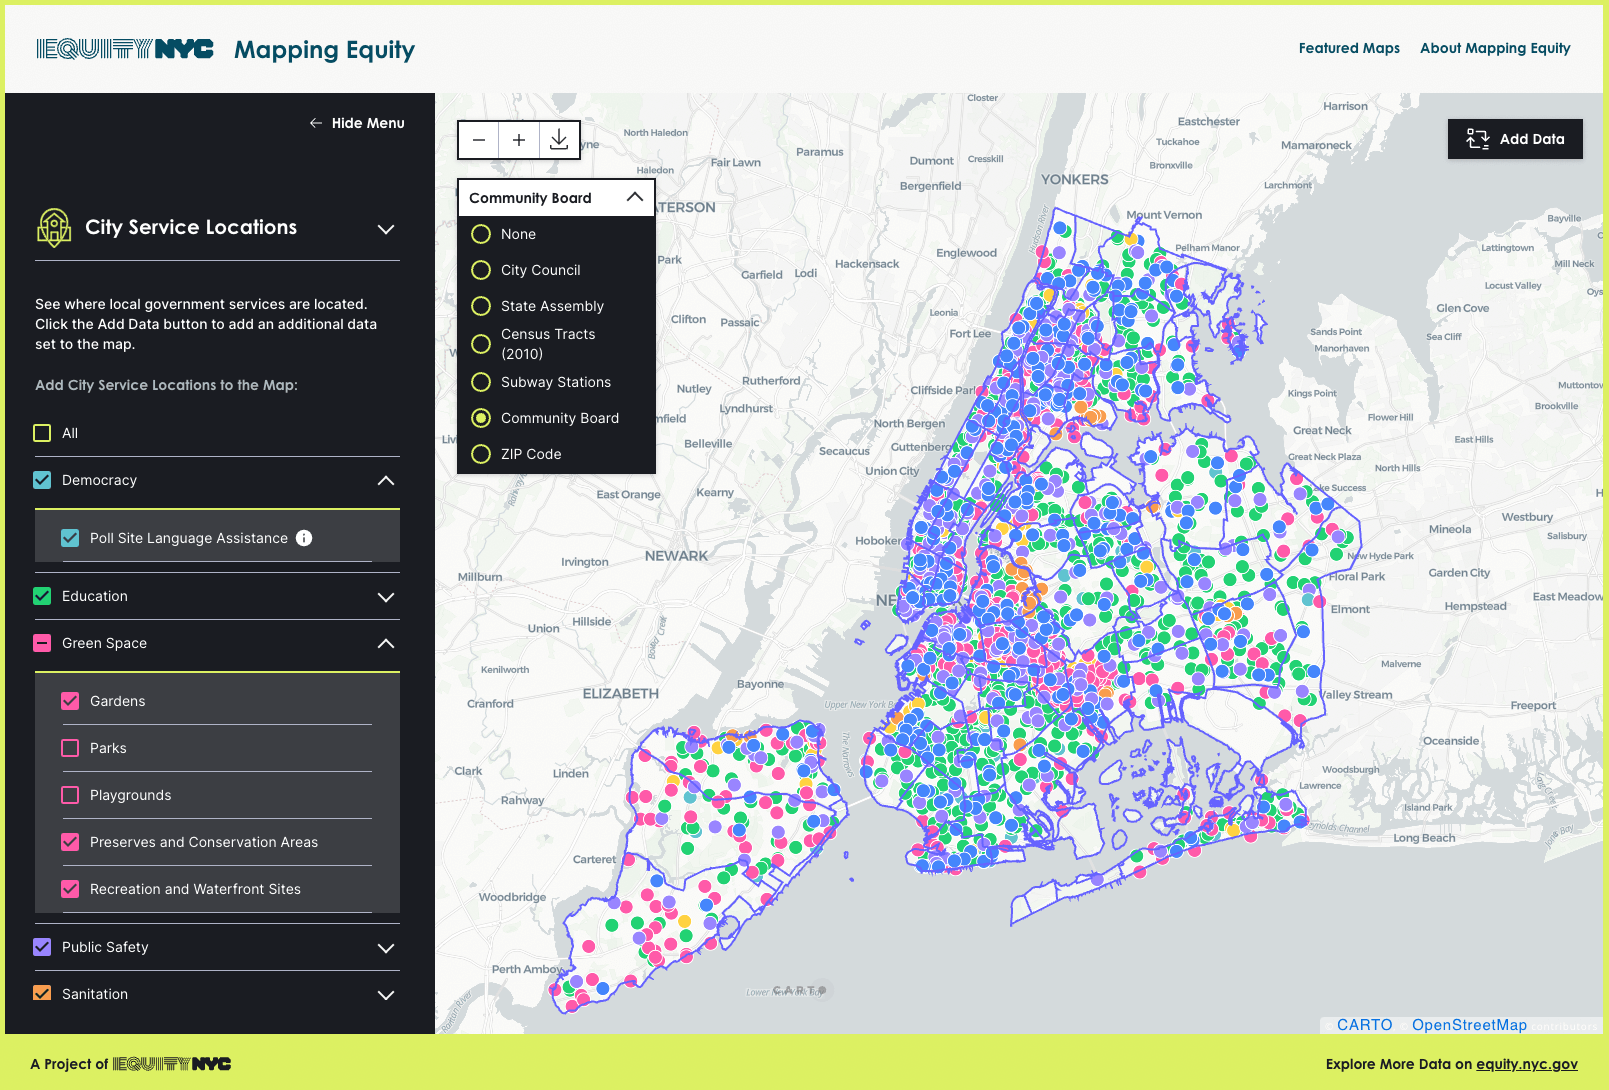
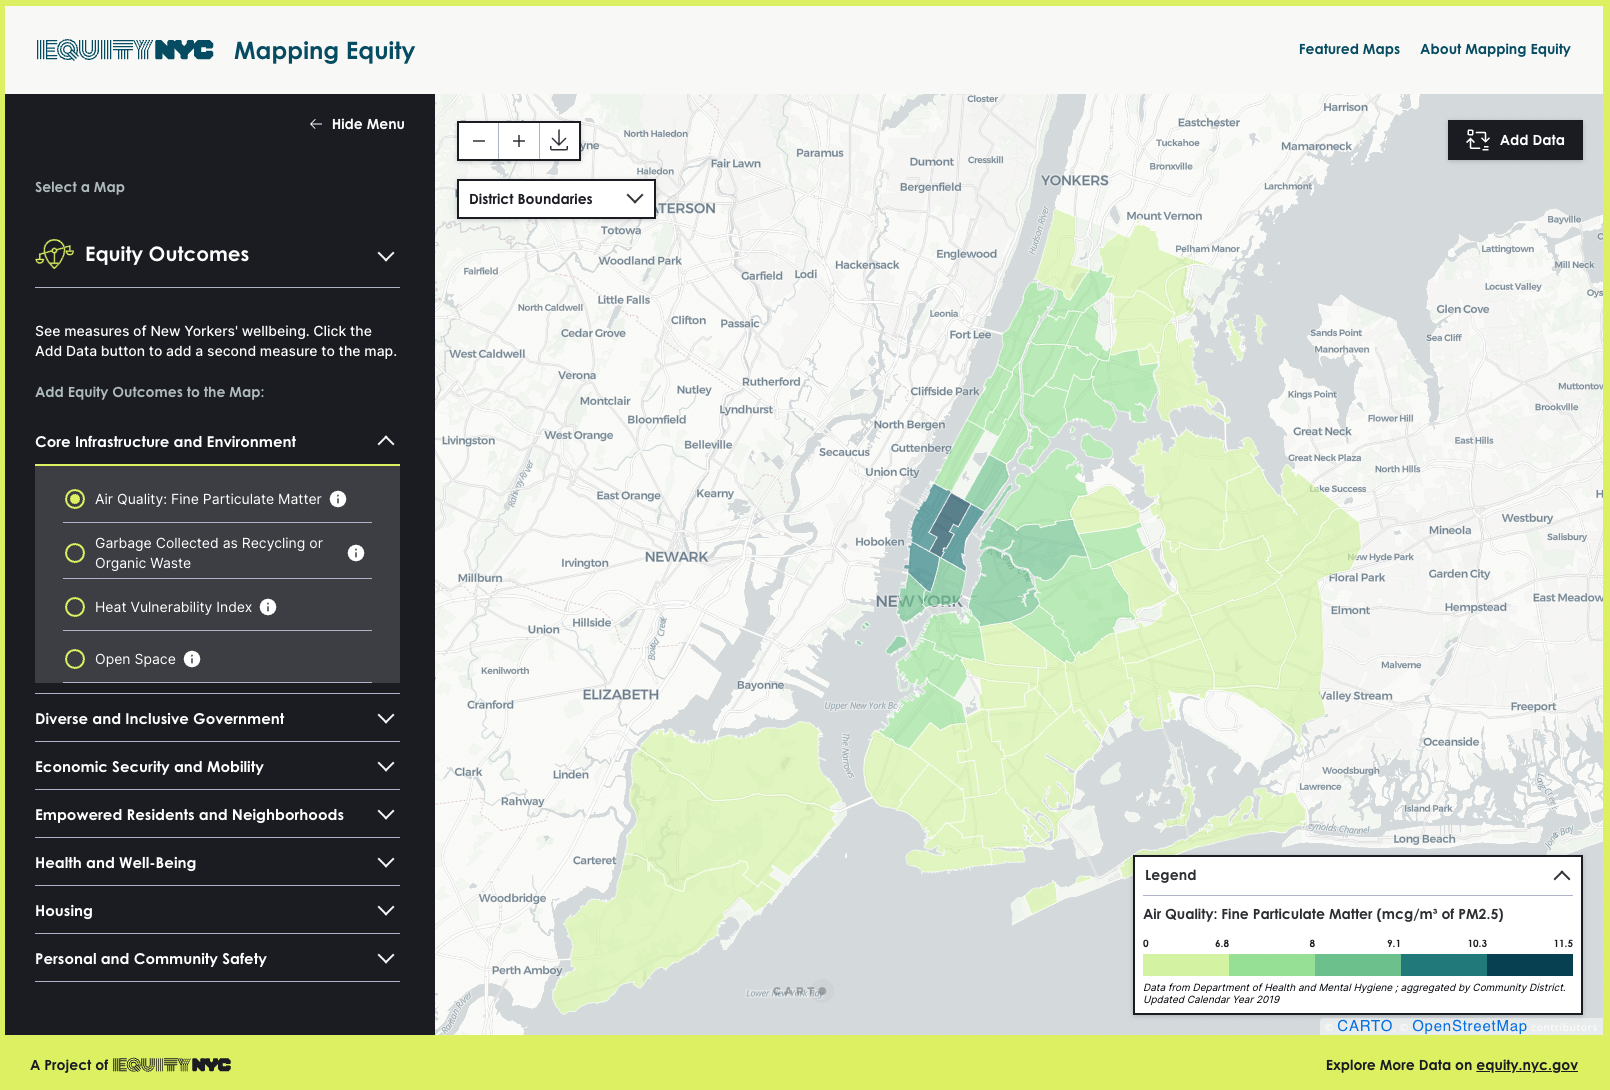
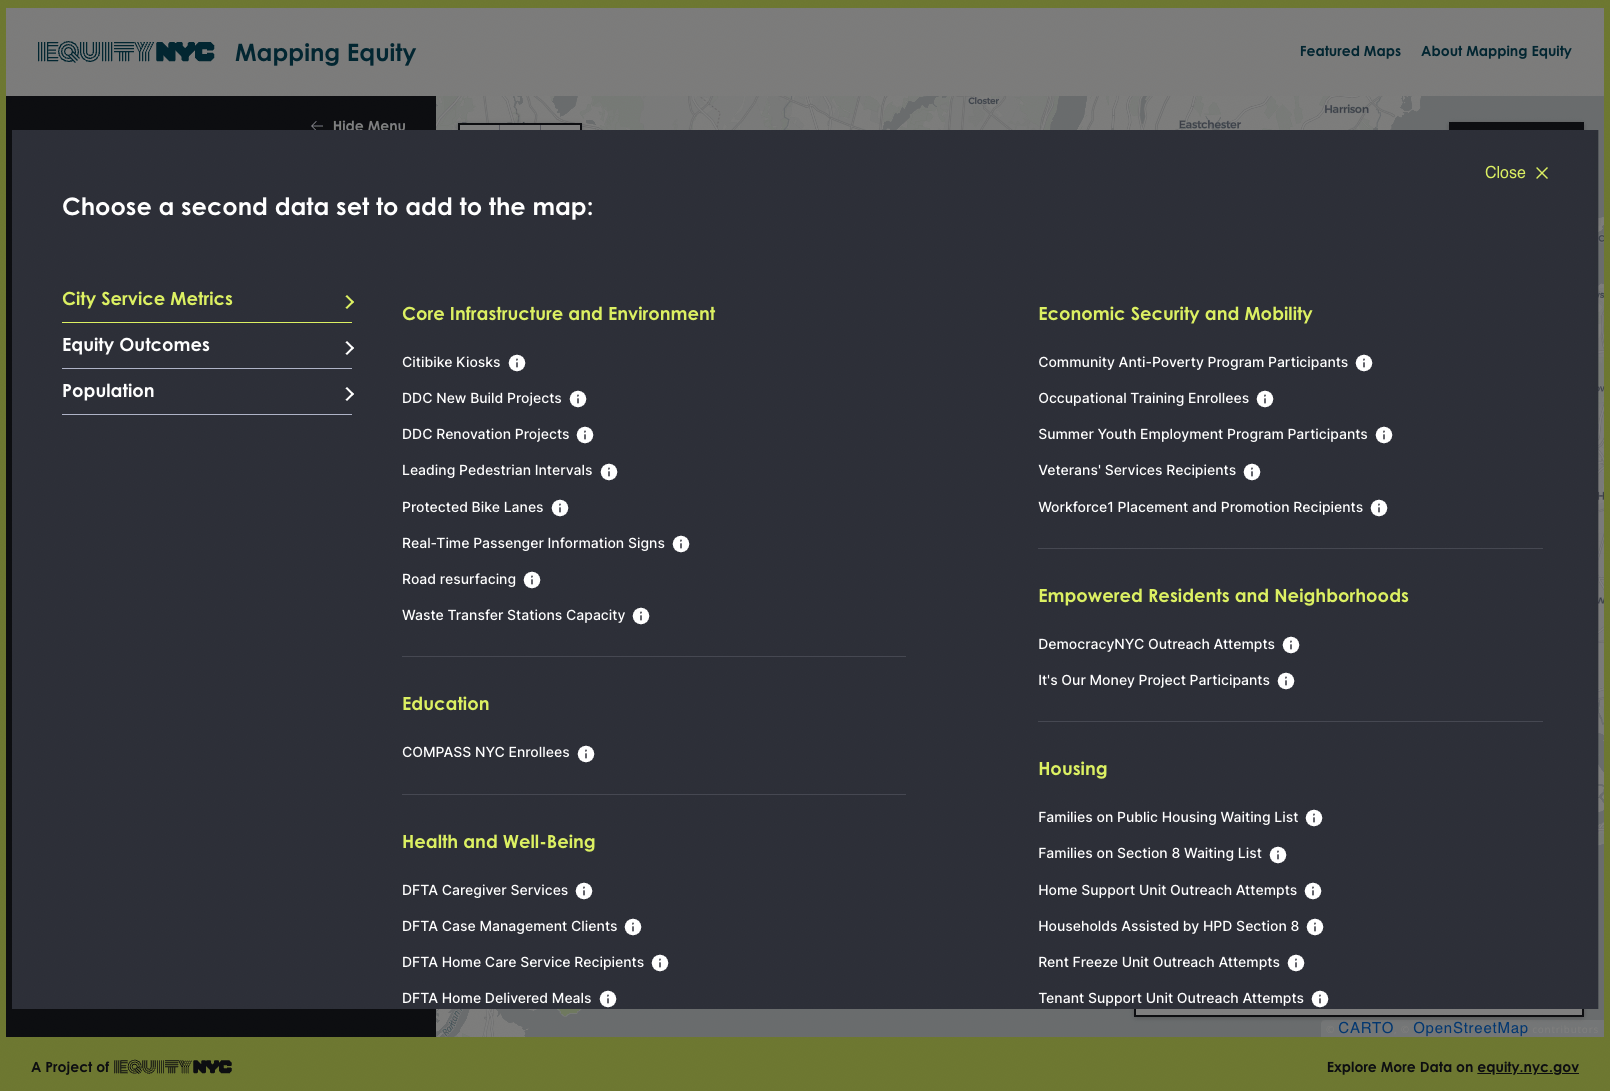
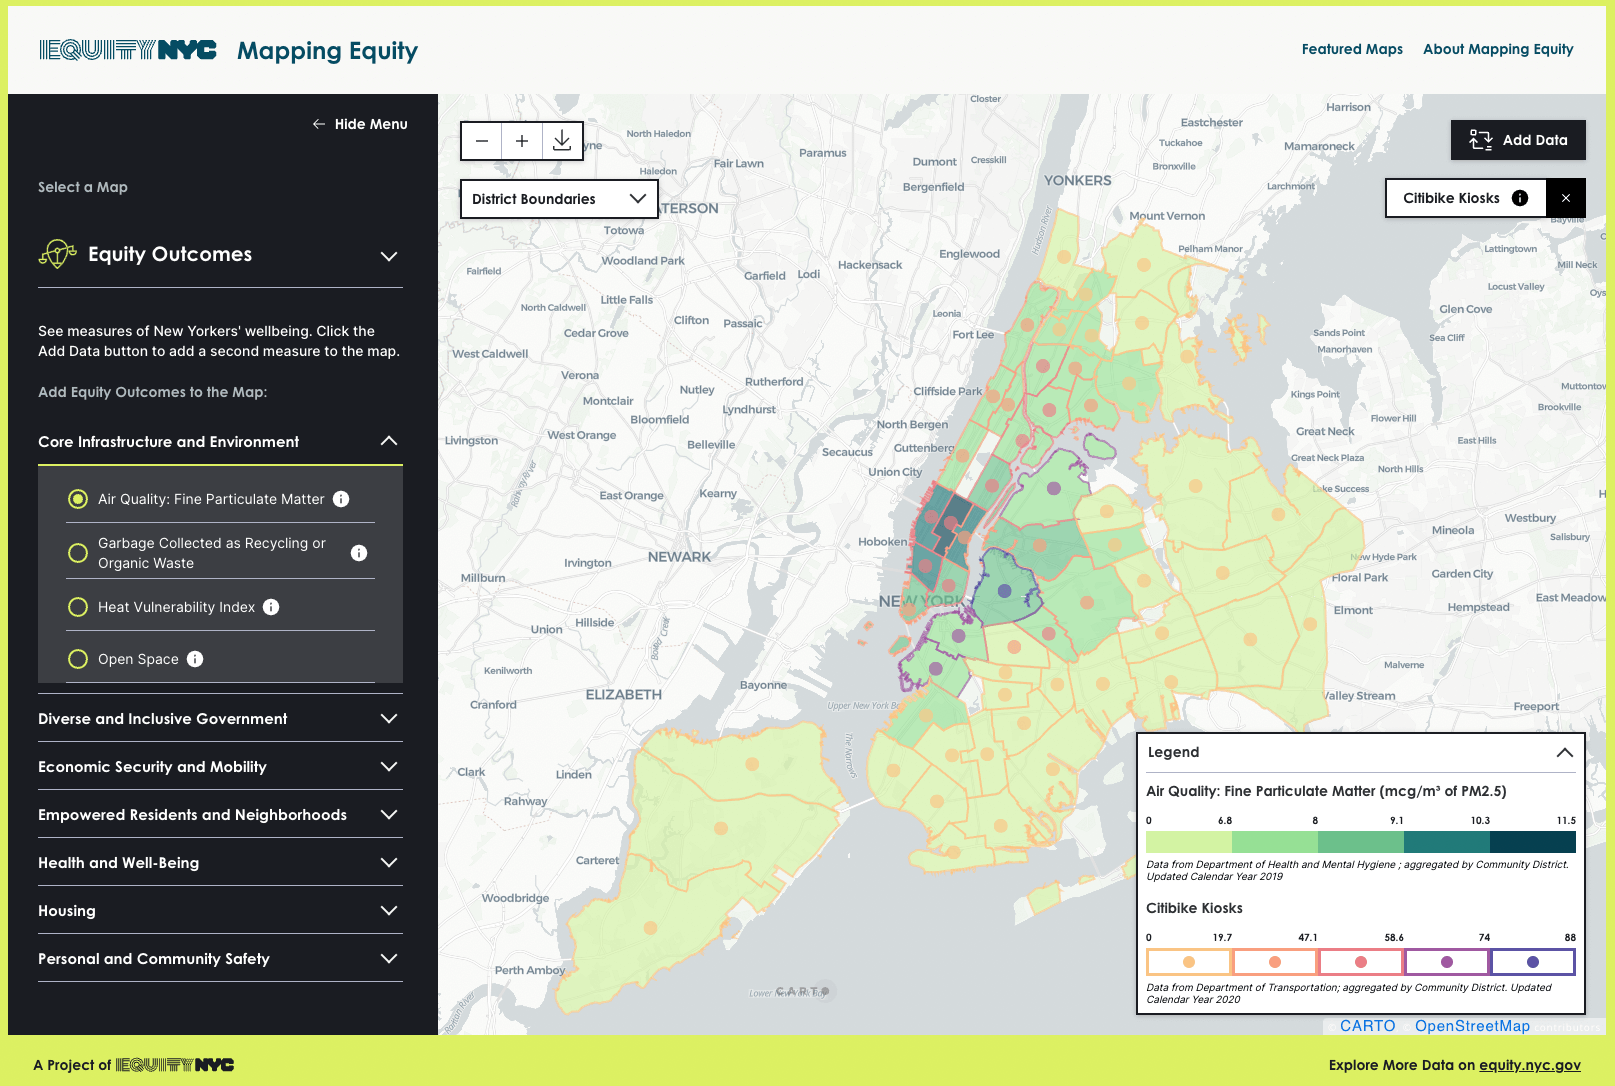
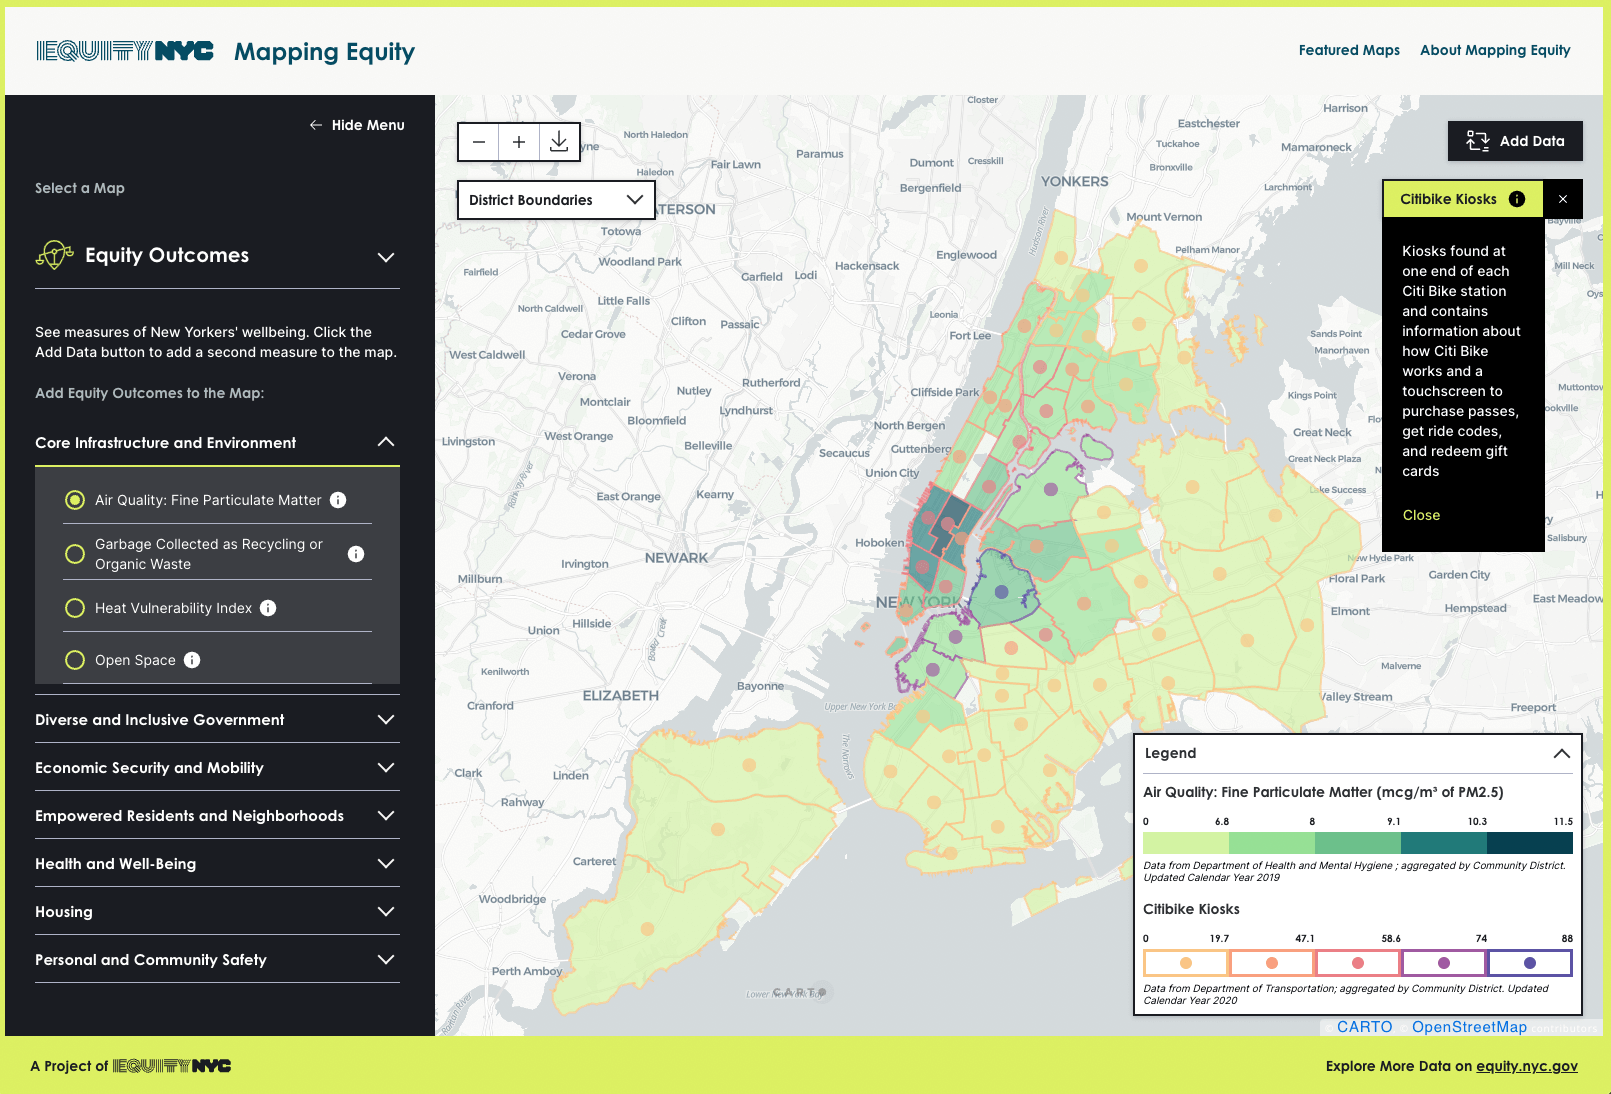
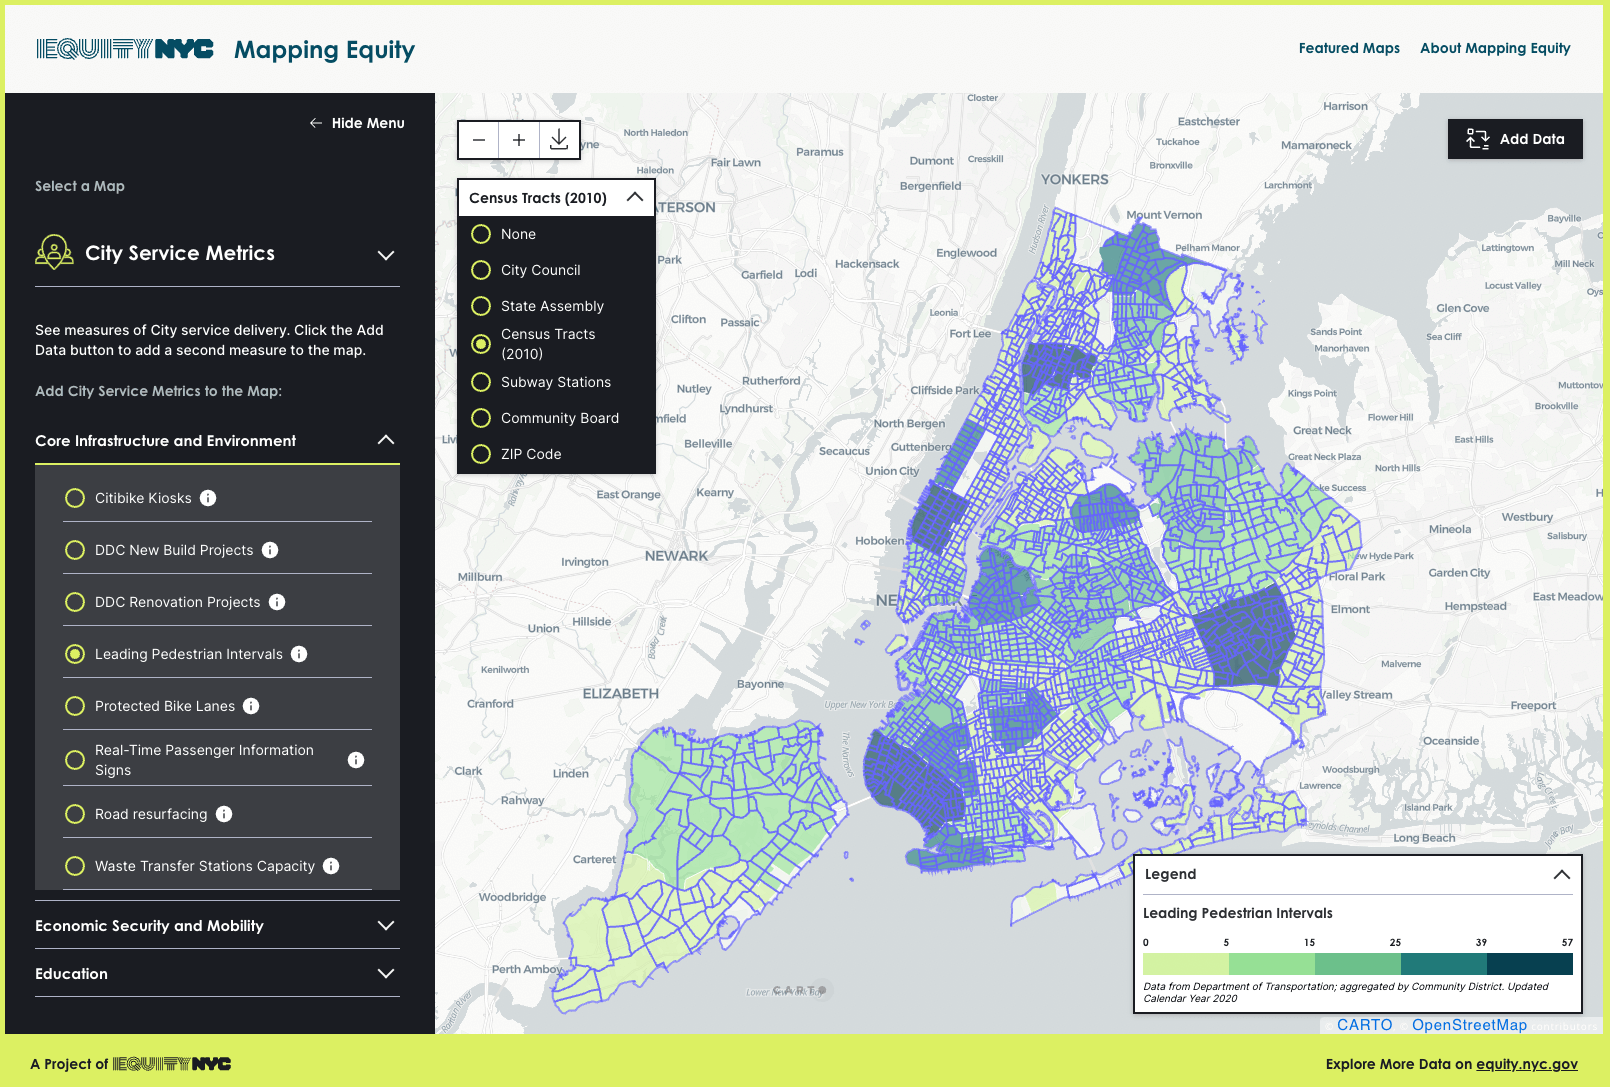
Map local data to see a geographic picture of New Yorkers' quality of life, public service distribution, and demographics. Here are the features list:
- Based on the selection it will render different map types
- List of the featured map, User can navigate to pre-filtered feature map
- Users can zoom it to any level
- Users can download the actual dataset which rendered on map
- Users can compare two maps
- Users can filter data through navigation panel
- Users can share filtered map, each filtered map will be converted to unique URL
Screenshots